










October 1 Manufacturing PMI: What the 50 Line Really Means
September 28, 2026. Preview of the scheduled September manufacturing survey; September's result has not been released.
A factory survey can weaken while still pointing to expansion. That is the distinction to keep beside the next ISM Manufacturing PMI release, scheduled for Thursday, October 1, on ISM's official calendar. The release covers September activity. It is a new observation about factories, not a direct reading of the whole economy's growth rate.
For readers following the week's economic news, the useful question is two-part: where does the index sit, and how has it changed? Answering only one can produce a misleading headline.
Above 50 can still mean slowing
ISM treats a Manufacturing PMI above 50 as general sector expansion and below 50 as contraction. Its August report recorded 54.6, down from July's 55.6. Those are dated survey readings, not September results or prediction-market probabilities.
The distinction is visible without a forecast: August remained above the threshold while falling from the previous month. A lower index and contraction are therefore not interchangeable descriptions. Likewise, an increase that remains below 50 would not automatically mean the sector had returned to expansion.
When October's release arrives, write the new level and its change in separate columns. Add a third column for the threshold interpretation. This small habit makes it harder to turn “better than last month” into a broader claim than the evidence supports.
A survey balance, not a percentage growth rate
The ISM methodology calculates diffusion indexes from positive responses plus half the unchanged responses. The headline combines five equally weighted components: new orders, production, employment, supplier deliveries and inventories.
Here is a hypothetical, unadjusted illustration, not an ISM result. Suppose 30 of 100 respondents report an increase, 50 report no change and 20 report a decrease. The calculation is 30 + half of 50, giving 55. Nothing in that arithmetic says output grew 5 percent. The answers describe directions; they do not tell us how large each respondent's increase or decrease was.
Now imagine a reader saving that hypothetical 55 beside a company's actual production growth percentage. Both entries contain numbers, but the labels do different work. Keeping “diffusion index” on the first entry prevents a false comparison before it starts. The same discipline helps when copying figures into a forecast journal or sharing a short post.
Check what moved inside the headline
Supplier deliveries needs special care: in ISM's report definitions, an index above 50 means slower deliveries. A higher component is not automatically faster service. Read it alongside demand and production rather than assigning a cause from its direction alone.
A useful release note could be just four lines: the headline, new orders, production and the component that most needs explanation. Keep observation separate from interpretation. “Delivery times lengthened” and “demand caused delivery times to lengthen” are different claims; the second needs supporting evidence.
Build the question before comparing a market
For a prediction-market contract, first identify the publisher, index, reference month and threshold. A question about the ISM manufacturing headline is different from one about services, employment or another provider's survey. Copy the actual settlement terms, including rounding and the treatment of later revisions, before comparing prices.
Predictions' Kalshi and Polymarket comparison guide is a starting point for venue research. Keep the source document open beside any contract you investigate. A shared topic or similar title is not enough to establish that two contracts settle on the same result.
This week's reading list also includes our PCE guide and payrolls and unemployment guide. Give each release its own row. On October 1, start with what manufacturing respondents reported, then decide which wider questions the evidence can actually answer.
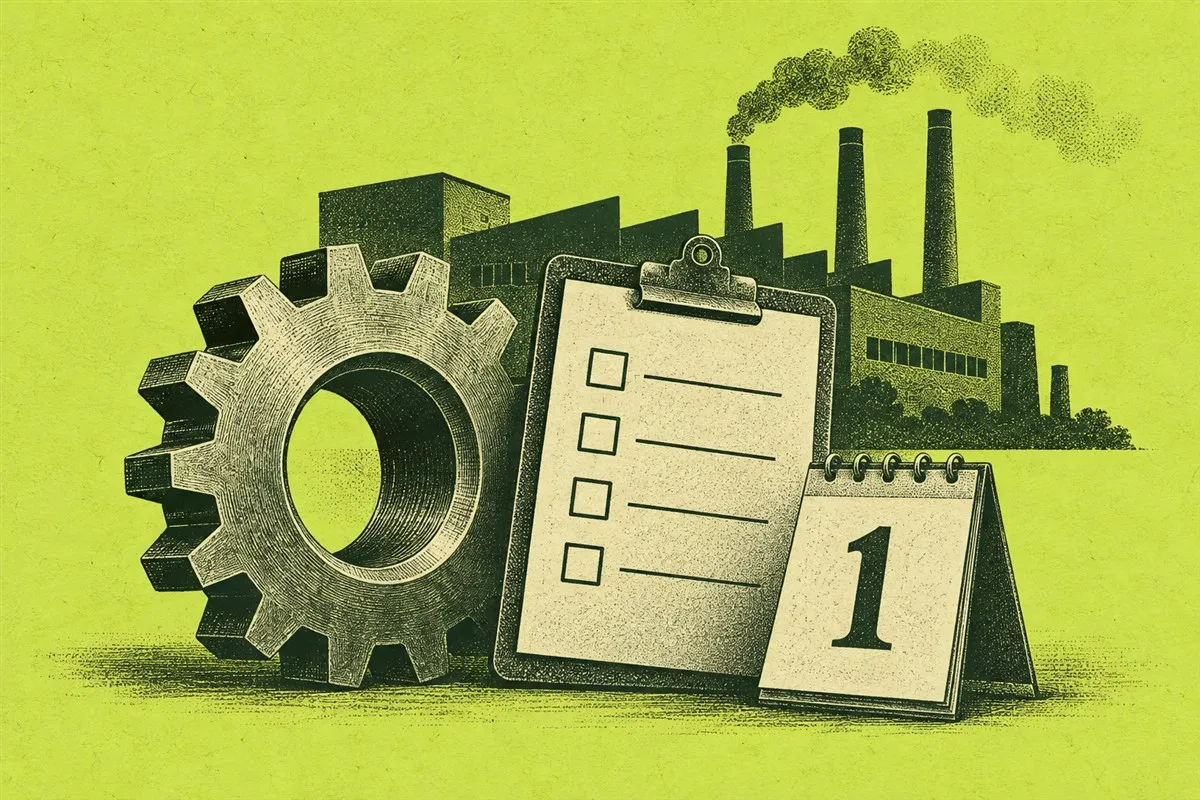
Hero: original AI-generated conceptual illustration of a factory, cog, survey clipboard and calendar marked 1. It depicts no actual survey data.


